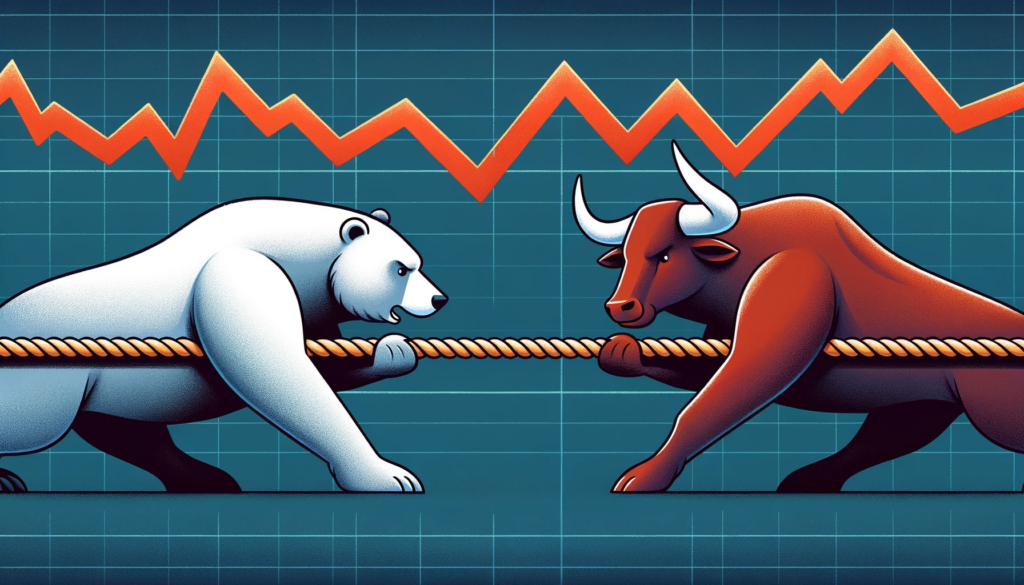
In the realm of financial markets, including cryptocurrencies, one commonly heard term is a ‘bear market.’ This phenomenon is not confined to cryptocurrencies but is a common occurrence in traditional markets such as stocks, bonds, real estate, and commodities. A bear market implies a strong downward trend in market prices, often leading to significant losses over a relatively short period.
Defining a Bear Market
A bear market is marked by a period of generally falling prices in a particular market. The term is widely recognized in various sectors, including cryptocurrency and traditional financial markets. Bear markets often result from a loss of investor confidence in the market’s overall performance, leading to a widespread selling-off of holdings. This negative sentiment is typically triggered by various factors, such as economic downturns, geopolitical events, or changes in monetary policy.
Cryptocurrency markets, due to their comparatively smaller size and higher volatility, are particularly susceptible to intense and prolonged bear markets. It’s not uncommon to witness price drops of up to 85% in crypto bear markets.
Identifying a Bear Market

While a 20% drop in market prices within a 60-day period is often taken as a benchmark for a bear market in traditional sectors, the onset of a bear market is usually not this apparent. Market analysts and traders employ various tools and systems to identify less evident bearish trends and signals.
Commonly used indicators include:
- Moving Averages (MAs): MAs smooth out price data by creating a constantly updated average price.
- Moving Average Convergence Divergence (MACD): This is a trend-following momentum indicator that shows the relationship between two moving averages of a security’s price.
- Relative Strength Index (RSI): RSI is a momentum oscillator that measures the speed and change of price movements.
- On-Balance Volume (OBV): OBV uses volume flow to predict changes in stock price.
These technical analysis indicators can help traders navigate and strategize during a bear market.
Bear Market vs. Bull Market

The counterpart to a bear market is a bull market, characterized by rising prices and positive market sentiment. The confidence of traders often increases in a bullish trend, leading to more investment and further boosting prices.
Historical data shows that between 1929 and 2014, there were 25 instances each of bull and bear markets in the U.S. The average bear market recorded a loss of about -35%, while the average bull market saw gains of approximately +104%. These trends demonstrate the impact of market momentum on sustaining price increases (in bull markets) and decreases (in bear markets).
Understanding the dynamics of bear and bull markets can help traders make informed decisions and develop strategies that align with market conditions.
Final Thoughts
Bear markets, while challenging, are an integral part of financial market cycles. By understanding their nature and identifying their signs, investors can navigate these periods strategically and mitigate potential losses. Moreover, the knowledge of bear markets in relation to bull markets can provide comprehensive insights into the ebb and flow of market trends, aiding in more informed decision-making.
Remember, every bear market presents an opportunity for learning, growth, and preparation for the next bull market. After all, it’s the bear markets that make the bull markets worthwhile.

